A Comprehensive Guide to the MCP Inspector
Introduction
In the evolving landscape of AI and machine learning, integrating large language models (LLMs) with external tools and data sources has become increasingly important. The Model Context Protocol (MCP) emerges as a standardized solution to this integration challenge, enabling seamless communication between AI applications and various external systems.
At the heart of MCP's ecosystem lies the MCP Inspector—a powerful visual testing tool designed to aid developers in testing and debugging MCP servers. This guide delves deep into the MCP Inspector, exploring its features, setup, usage, and best practices.
Understanding the Model Context Protocol (MCP)
Before diving into the MCP Inspector, it's essential to grasp the fundamentals of the Model Context Protocol.
MCP is an open standard defining how AI applications, particularly LLMs, interact with external tools, data sources, and services. By providing a standardized interface, MCP simplifies the integration process, allowing developers to build AI applications that seamlessly access external functionalities.

Key components of MCP include:
- MCP Servers: Expose tools, resources, and prompts to clients.
- MCP Clients: Reside within host applications and communicate with MCP servers.
- Transports: Define the communication method between clients and servers, such as HTTP or standard input/output.
What is the MCP Inspector?
The MCP Inspector is a developer-centric tool designed to test and debug MCP servers. It provides a visual interface allowing developers to:
- Launch and interact with MCP servers.
- Inspect available tools, resources, and prompts.
- Send requests and view responses in real-time.
- Monitor server behavior and logs.
By simulating client interactions, the MCP Inspector ensures MCP servers function correctly and adhere to protocol specifications.
Key Features of MCP Inspector
- Visual Interface: Intuitive UI to interact with MCP servers.
- Command Execution: Run MCP servers directly from the interface.
- Environment Configuration: Supports setting environment variables and command-line arguments.
- Authentication Support: Bearer token authentication for secure connections.
- Proxy Server: Facilitates communication via an MCP Proxy server.
- Customizable Ports: Change default ports for client UI and proxy server.
- Configuration Files: Load server configurations from JSON files.
Installation and Setup
Prerequisites
- Node.js: Version 22.7.5 or higher.
Install nvm (Node Version Manager)
Windows
- Visit the nvm-windows release page.
- Download
nvm-setup.exefrom the latest release. - Double-click the installer to install nvm.
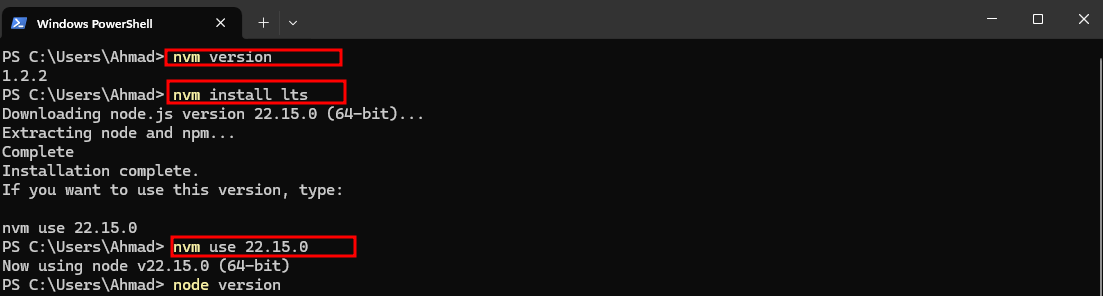
- After installation, open PowerShell and run:
# Install the latest LTS version of Node.js
nvm install --lts

# Use the version number returned by the install command
nvm use 22.15.0
Set up npx on Windows
By default, Windows may block execution of scripts, which can prevent npx from working. To fix this, you'll need to update the execution policy.
Note: These steps must be run in PowerShell as Administrator.
# Check the current execution policy
Get-ExecutionPolicy
If the output is:
Restricted
Then run:
Set-ExecutionPolicy RemoteSigned
This will allow scripts installed via npm (including npx) to run.
You can confirm the policy was updated successfully with:
Get-ExecutionPolicy
Finally, verify that npx is now available:
npx --version
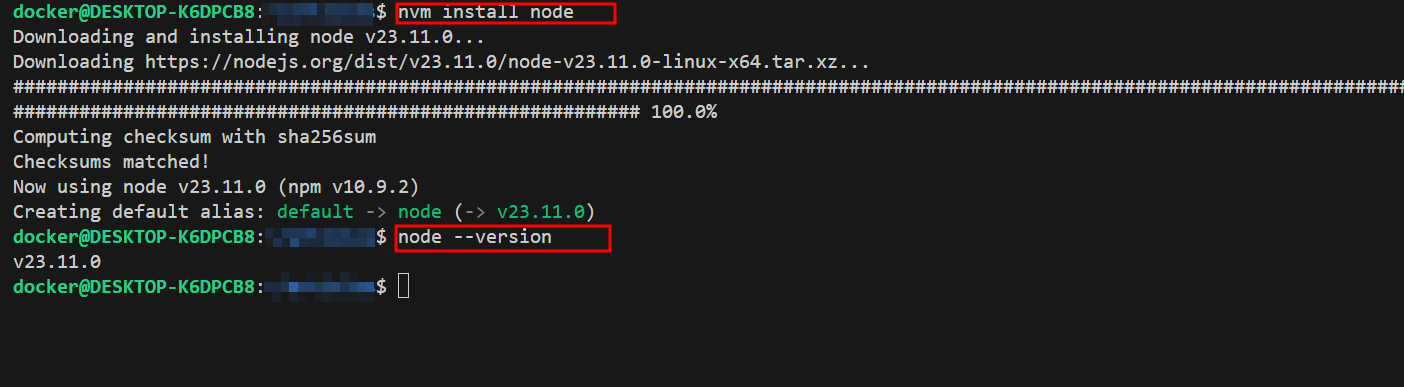
Linux
curl -o- https://raw.githubusercontent.com/nvm-sh/nvm/v0.40.3/install.sh | bash
nvm install node
Using the MCP Inspector
We’ll demonstrate how to use the MCP Inspector with the official BraveSearch MCP server from the MCP GitHub repository. The process is the same whether you're on Windows, Linux, or macOS—the commands work identically across platforms.
Step 1: Clone and Build the BraveSearch MCP Server
Clone the repository and navigate to the BraveSearch folder:
git clone https://github.com/modelcontextprotocol/servers.git
cd servers/src/brave-search
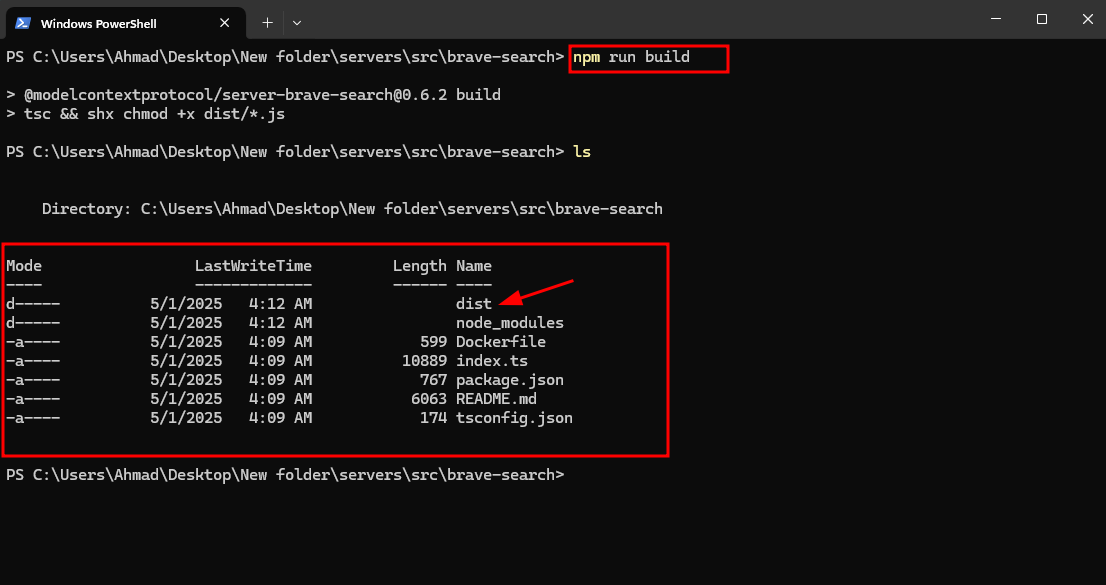
Install dependencies and build the server:
npm install
npm run build
After a successful build, you’ll see output similar to:
Step 2: Kick the Tyres with MCP Inspector
Now it's time to "kick the tyres" and test our BraveSearch MCP server using the MCP Inspector. Launch MCP Inspector directly with npx:
npx @modelcontextprotocol/inspector -e BRAVE_API_KEY=BRAVE_API_KEY -- node dist/index.js
Open your browser and navigate to:
http://localhost:6274
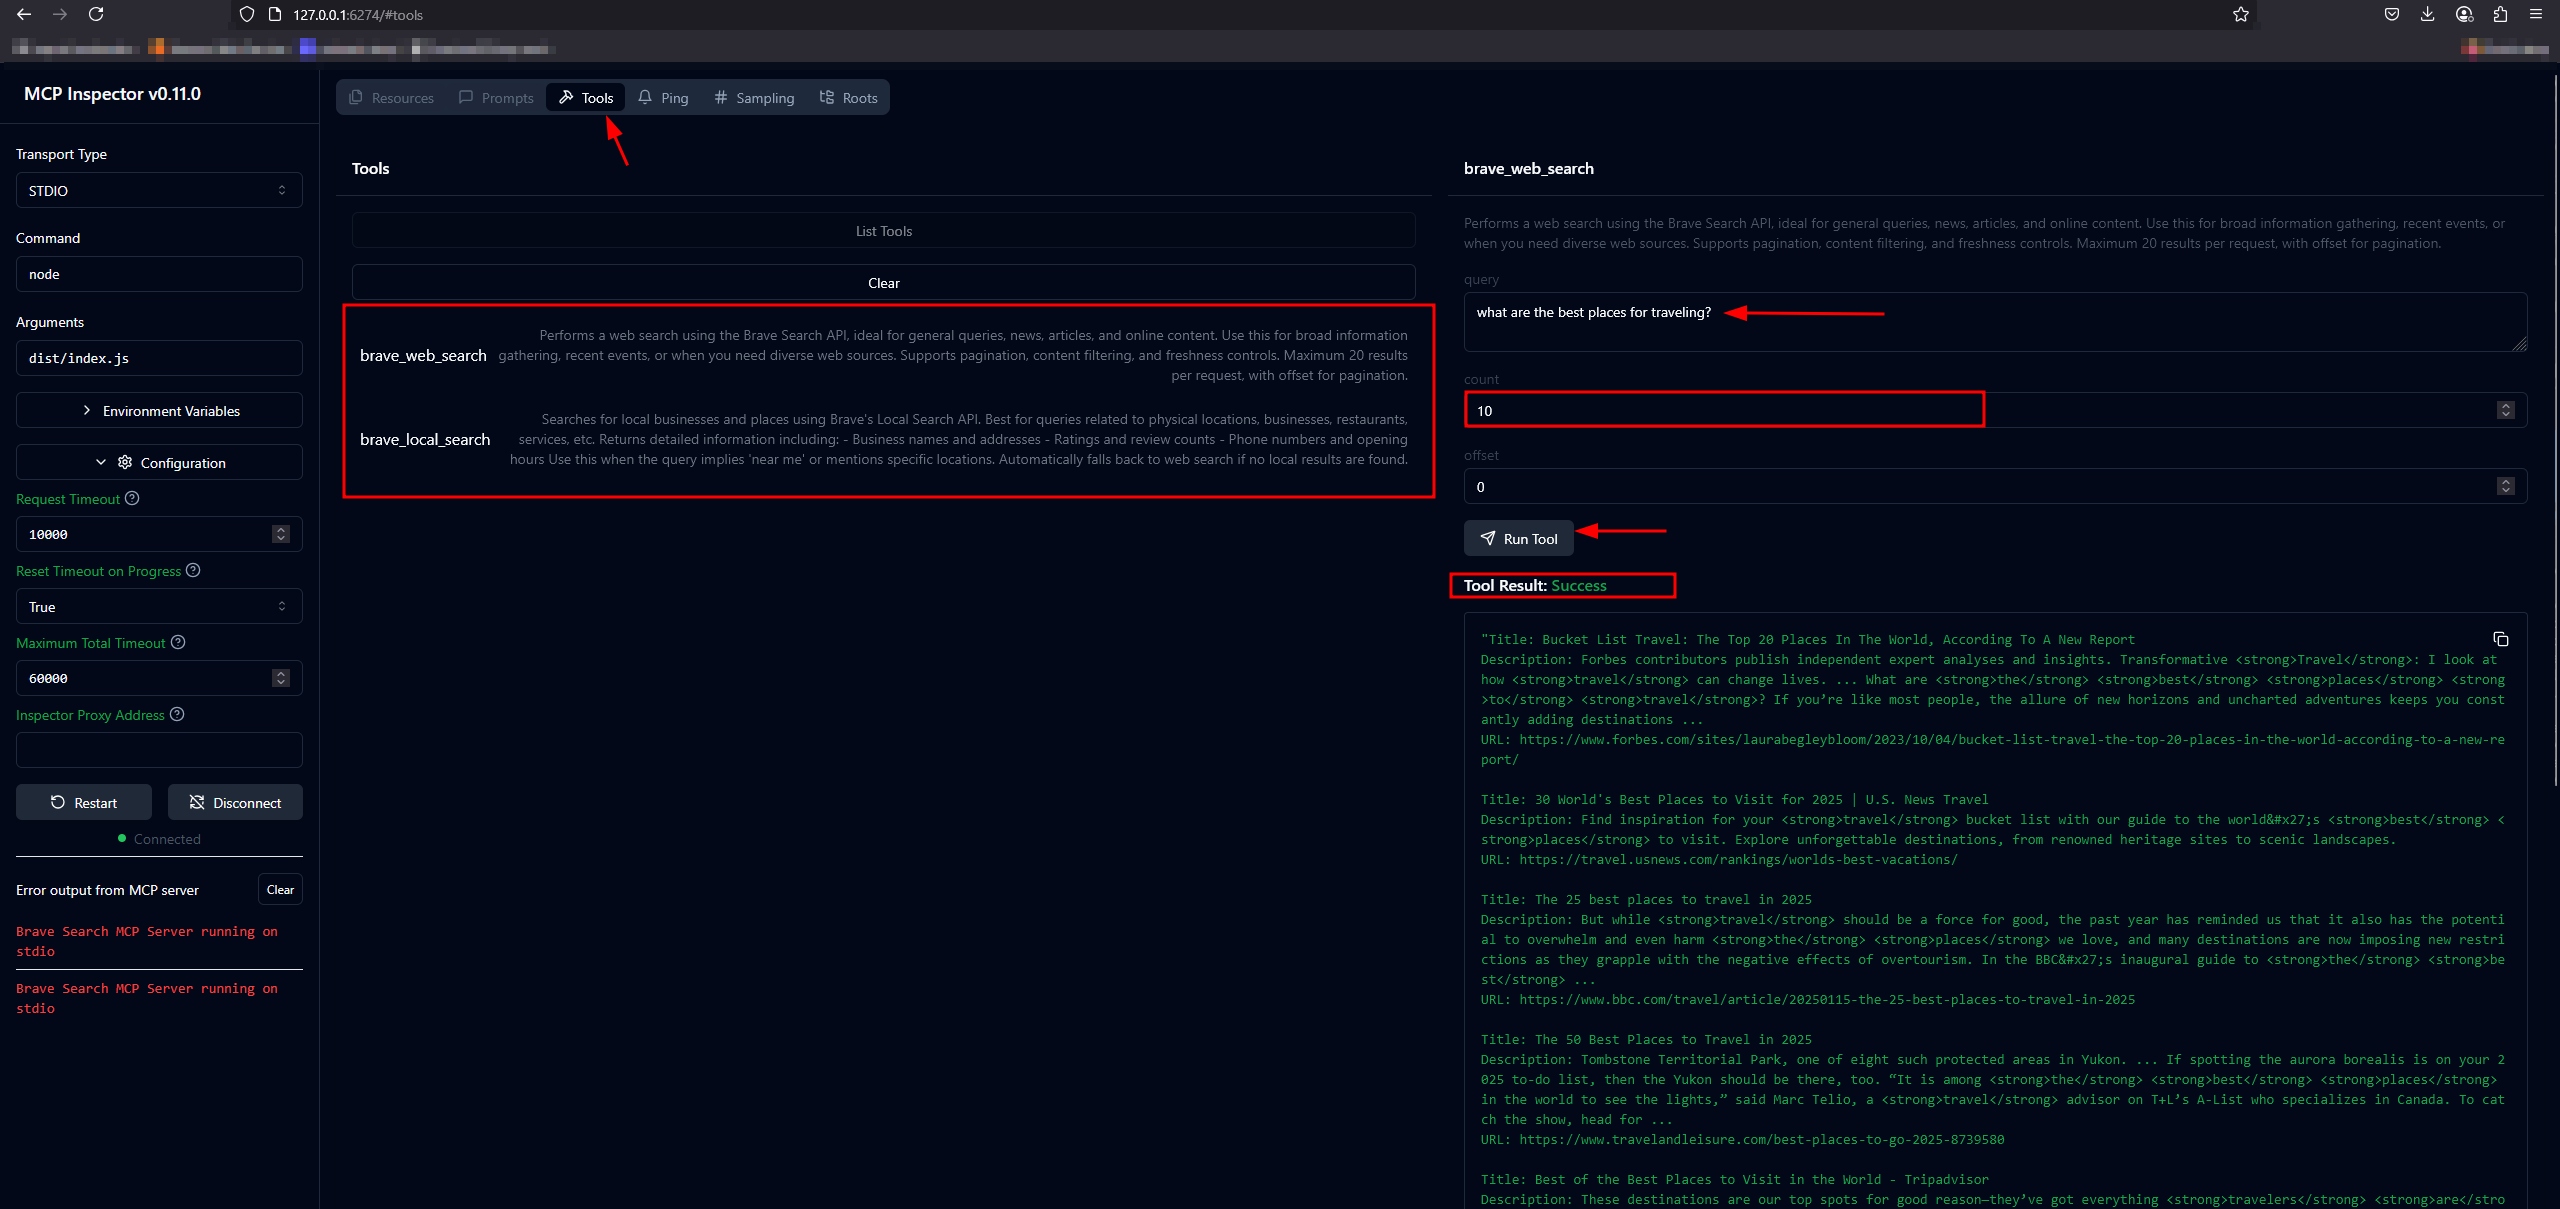
Step 3: Connecting and Testing
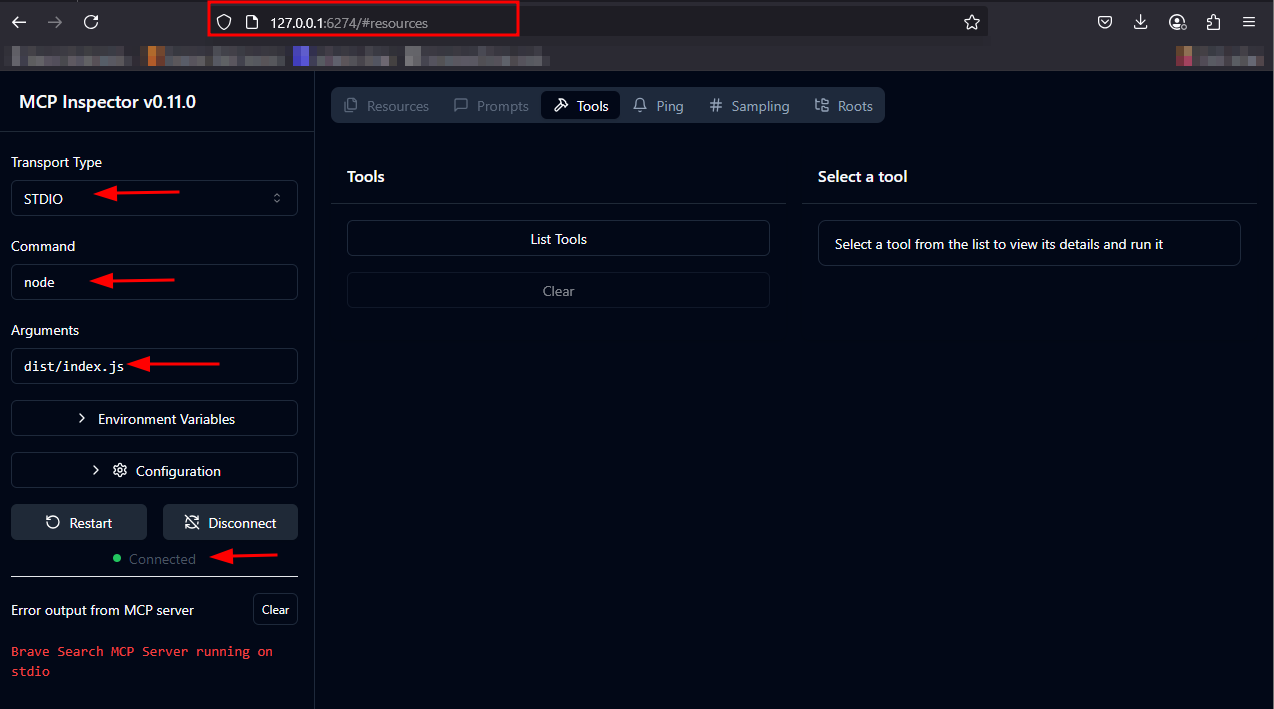
In the MCP Inspector UI:
- Select the transport type (
stdiois recommended). - Confirm your environment variables are set (e.g.,
BRAVE_API_KEY). - Click Connect.
Now you can explore tools, invoke searches, and inspect responses provided by the BraveSearch MCP server directly from the intuitive Inspector interface.
Step 4: Explore Tools, Resources, and Prompts
Once connected:
-
Tools: View and invoke available tools exposed by the server.
-
Resources: Access and inspect resources provided by the server.
-
Prompts: Examine predefined prompts for interacting with the server.
Authentication
For servers requiring authentication:
- Enter your Bearer Token in the designated field.
- Optionally, specify a custom header name if different from the default
Authorization.
Configuration Options
The MCP Inspector allows real-time configuration through its UI. Key settings include:
MCP_SERVER_REQUEST_TIMEOUT: Timeout for server requests (default:10000ms).MCP_REQUEST_TIMEOUT_RESET_ON_PROGRESS: Reset timeout on progress notifications (default:true).MCP_REQUEST_MAX_TOTAL_TIMEOUT: Maximum total timeout for requests (default:60000ms).MCP_PROXY_FULL_ADDRESS: Full address of the proxy server if running on a non-default address.
You can adjust these settings via the Configuration button in the MCP Inspector UI.
Using Configuration Files
If you're working with multiple MCP servers or want a cleaner way to launch the Inspector, you can define your server configuration in a JSON file.
🛠 Create config.json
In your project root, create a file named config.json and add the following content:
{
  "mcpServers": {
    "brave-search": {
      "command": "node",
      "args": ["dist/index.js"],
      "env": {
        "BRAVE_API_KEY": ""
      }
    }
  }
}
🔐 Note: Replace the empty string in
BRAVE_API_KEYwith your actual key before running.
▶ Launch MCP Inspector with Config
You can now start the Inspector using the --config flag and specify which server to launch from the config file:
npx @modelcontextprotocol/inspector --config ./config.json --server brave-search
This command:
- Loads server definitions from your config.json
- Automatically injects environment variables
- Connects to the specified server (brave-search) using the dist/index.js entrypoint
✅ This approach keeps your command line clean and makes it easier to manage multiple servers or reuse settings.
Security Considerations
The MCP Inspector includes a proxy server. Important security notes:
- Do Not Expose: Avoid exposing the proxy server to untrusted networks.
- Access Control: Implement appropriate access controls.
- Environment Variables: Be cautious with sensitive data in environment variables.
Advanced Usage
The MCP Inspector CLI can be used to automate tasks, debug tool integrations, and connect to both local and remote MCP servers. Below are practical examples covering advanced capabilities.
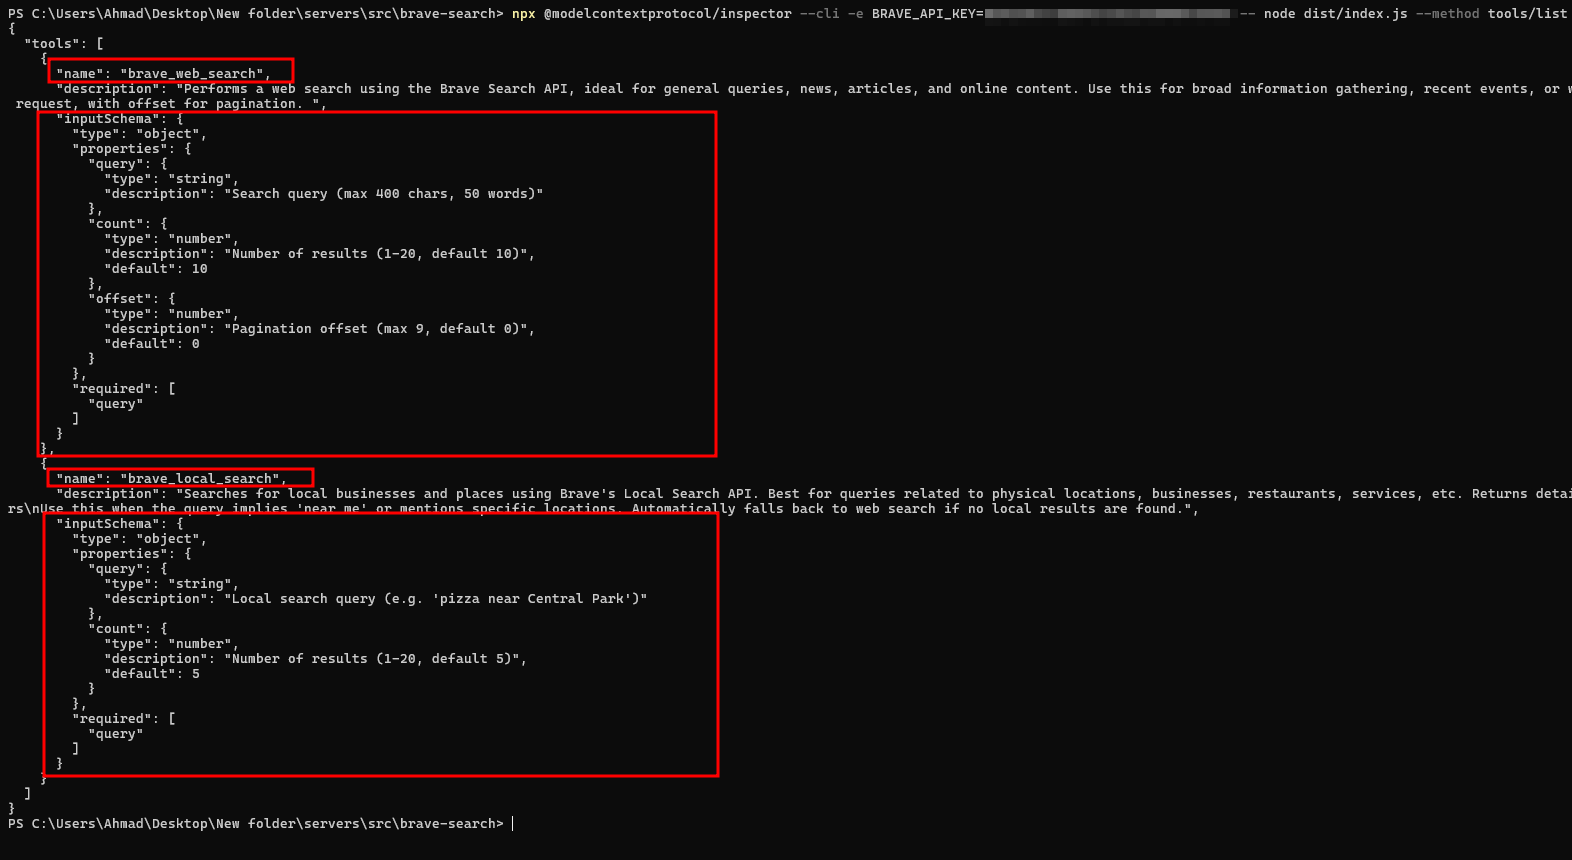
🔍 List Tools Using CLI Mode
List all available tools exposed by the Brave Search MCP server:
npx @modelcontextprotocol/inspector --cli -e BRAVE_API_KEY=YOUR_API_KEY -- node dist/index.js --method tools/list
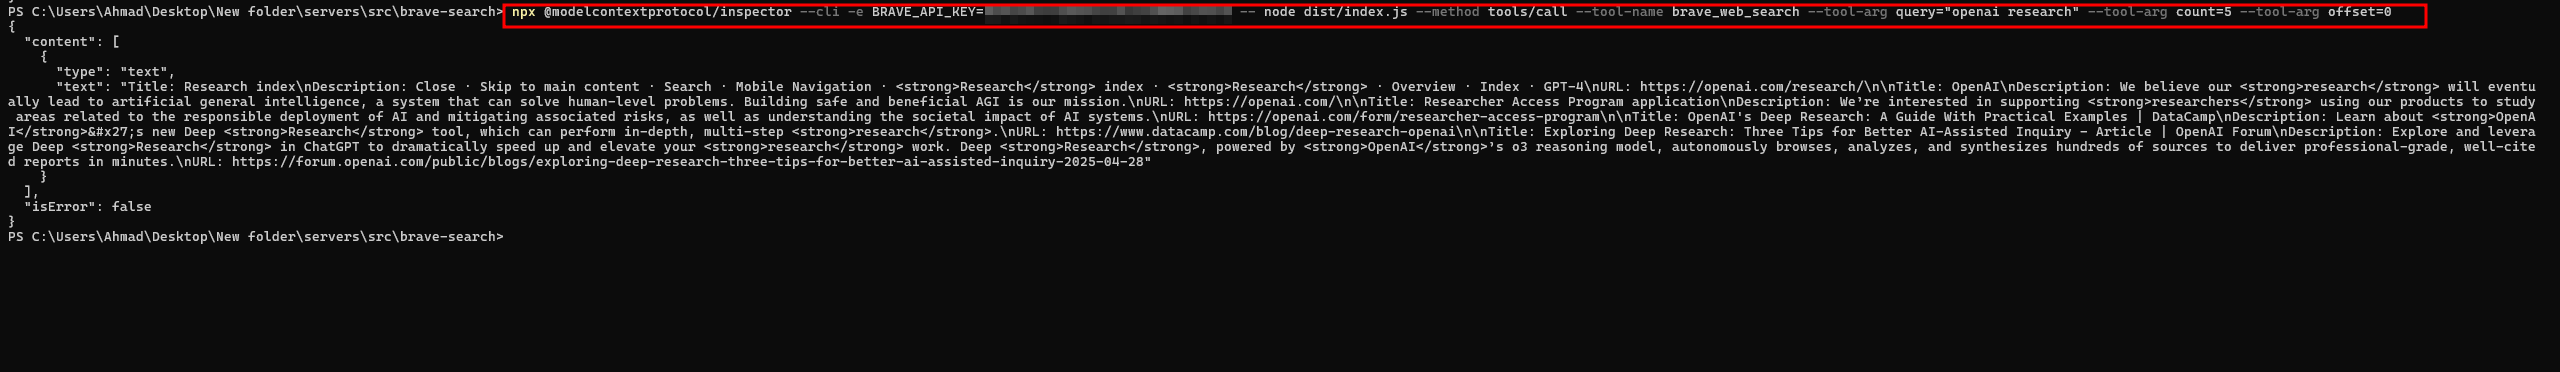
🚀 Call a Tool with Arguments
Invoke a specific tool (brave_web_search) with parameters:
npx @modelcontextprotocol/inspector --cli -e BRAVE_API_KEY=YOUR_API_KEY -- node dist/index.js --method tools/call --tool-name brave_web_search --tool-arg query="openai research" --tool-arg count=5 --tool-arg offset=0
--tool-name: The tool you want to call (from thetools/listoutput).--tool-arg: Each input parameter formatted askey=value.-e: Environment variables passed to the underlying server.
🗃️ Summary of Common Commands
| Description | Command |
|---|---|
| 🔧 Basic usage | npx @modelcontextprotocol/inspector --cli node build/index.js |
| ⚙️ With config file | npx @modelcontextprotocol/inspector --cli --config path/to/config.json --server myserver |
| 📋 List available tools | npx @modelcontextprotocol/inspector --cli node build/index.js --method tools/list |
| 🛠️ Call a specific tool | npx @modelcontextprotocol/inspector --cli node build/index.js --method tools/call --tool-name mytool --tool-arg key=value --tool-arg another=value2 |
| 📦 List available resources | npx @modelcontextprotocol/inspector --cli node build/index.js --method resources/list |
| 🧠 List available prompts | npx @modelcontextprotocol/inspector --cli node build/index.js --method prompts/list |
| 🌐 Connect to a remote MCP server | npx @modelcontextprotocol/inspector --cli https://my-mcp-server.example.com |
| 📡 Call tool on remote server | npx @modelcontextprotocol/inspector --cli https://my-mcp-server.example.com --method tools/call --tool-name remotetool --tool-arg param=value |
| 🌍 List resources from remote | npx @modelcontextprotocol/inspector --cli https://my-mcp-server.example.com --method resources/list |
Troubleshooting Common Issues
- Connection Failures: Verify MCP server accessibility.
- Authentication Errors: Confirm bearer token validity.
- Timeouts: Adjust timeout settings.
- Environment Issues: Ensure necessary variables are set.
Conclusion
The MCP Inspector is more than just a visual debugging tool—it's a critical asset in the development and validation lifecycle of MCP-compliant servers. Whether you're building custom toolchains, integrating LLMs with external APIs, or simply exploring the capabilities of the MCP ecosystem, the Inspector offers both clarity and control.
This guide walked you through every step—from installation to advanced CLI automation—ensuring you're equipped to test, validate, and debug with confidence. By leveraging its real-time inspection, flexible configuration, and scripting capabilities, you can iterate faster and build more robust AI-integrated systems.
For deeper exploration or to contribute, be sure to check out:
Keep kicking the tires, and happy debugging! 🛠️